Single Transferable Vote (STV)
What is STV?
Ireland uses an unusual form of proportional representation called the Single Transferable Vote (STV). STV allows voters to rank candidates in order of preference. Northern Ireland, Malta and Scottish councils are the only other places in Europe to use it.
Constituencies can send 3, 4 or 5 Teachtaí Dála/Deputies (TDs) to Dáil Éireann (Irish Parliament), the system is quite proportional so the resulting Dáil broadly reflects the views of the electorate.
How to vote
Voters are given one ballot paper.
Voters rank candidates in order of preference. They write 1 next to the candidate they like the most, 2 beside whoever they like second most, 3 for third, 4 for 4th etc…
They can rank every candidate, just one or a few of them, it's entirely their choice. As a general rule: the more the better. The absolute best way to vote is to rank literally everyone on the ballot.
Counting the votes
There are 43 constituencies and 174 total seats up for grabs.
In each constituency, seats are given to candidates who reach the Quota. The Quota is determined by the D’Hondt formula. (100 divided by the number of seats+1).
In a three seat constituency the quota is 25%, in a four seater it’s 20%, and in a five it’s 16.7%.
First all number 1 preferences are counted. If a candidate wins more than the quota they are elected. Any extra votes above the quota are deemed ‘surplus’ are transferred to other candidates according to who those voters ranked as their next highest preference.
If no one reaches the quota, or those transfers don't elect someone else, whoever is in last place is eliminated. Those votes are then given to their voters' next highest preferences.
Transfers in Donegal
If two candidates are so far behind everyone else that, even if everyone who voted for the last placed candidate gave their 2nd preference to the second last placed candidate, they’d still be the next to be eliminated, we save time by just knocking them both out at once.
This continues until enough candidates reach the quota, or there are only as many candidates left elected as seats available. At that stage all of them are elected below the quota.
The counting is done by hand, and since they have to go round-by-round, it can take some time to complete. A count going into day 3 is not unheard of but the results should leave voters with at least one TD they can stomach.
Strategies
There’s very little that can be done to game the system. A voter who really likes someone who is expected to win easily could try giving their first preference to a smaller party in the hope they win a seat too. But, that’s about it.
For parties, there’s more to it.
If they want to win two or more seats in a constituency they need to make sure that all their voters don’t lump in behind the better known candidate. To do this they’ll split the constituency amongst their candidates. For example they might tell people in the western half to vote A -> B and those in the east to vote B -> A.
Get this wrong and you miss out on a winnable seat. You can also miss out if you run too many candidates and split your own vote too thinly. On the other hand, if you don’t run enough candidates you can win the first seat with a huge surplus which just goes to other parties so you miss out again.
All seats are equal so it doesn’t matter if you ‘top the poll’ or sneak the last one. Parties will prefer to get two candidates through in 4th and 5th than handily win the first seat but no more.
Our Projection
Our Projection uses a version of proportional swing at the constituency level.
For example: The Social Democrats won 4.8% of the overall vote in 2024. If the user input was to increase that to 9.6% the model would double their vote share across the country, but with controls and nuance to make sure that nothing impossible happens, like someone winning over 100% of the vote or getting minus results.
Currently, the projection includes every party in every constituency and assumes that parties stand as many candidates as last time, with some very small edits. If their projected vote share goes up by enough then additional candidates will appear automatically. Once the parties decide their strategies for the next election we will turn this off and set the number of candidates to the real number.
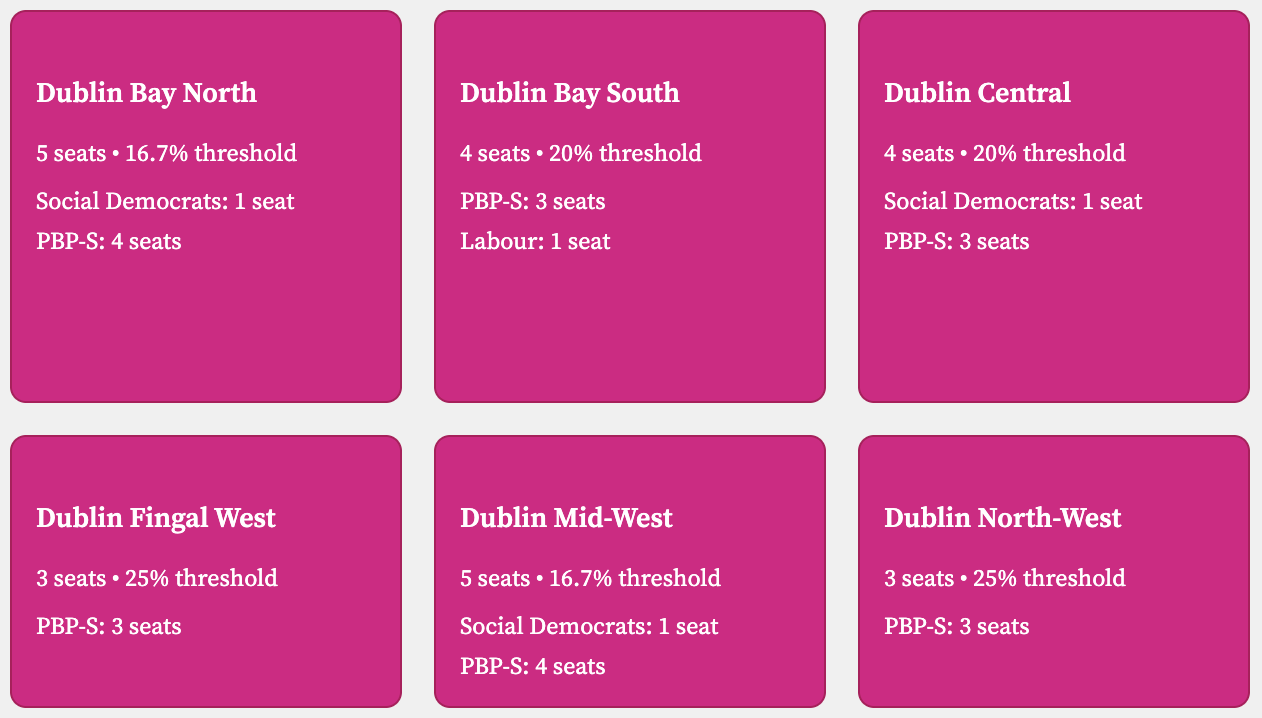
A PBP-S revolution (PBP-S on 60%)
Independents are tricky, so we’ve had to do some special sauce work here. Generally, if a party is down in the polls then basically all their candidates will also be down, but that logic doesn’t hold up with independents. We’ve tried to modify this by accounting for other trends but we are less confident in our projection of independents than other TDs.
Modelling Transfers
Transfers are decided by voters when they rank candidates in order of preference. Generally, transfers go to like minded candidates, especially to candidates of the same party.
For example, if all major parties stood a single candidate and ignoring independents:
The model expects most PBP-S voters to give their second preference to the Social Democrats and Labour, but some would prefer Sinn Féin. Some voters will only vote for PBP-S and no one else (Non-transferable). If fellow left-wing parties aren’t an option at that stage (because they were elected or eliminated), some PBP-S voters will give a lower preference to Fianna Fáil, but very few will give anything to Independent Ireland or to a small far-right party.
This model does the same for every party. It is calculated dynamically depending on which parties are left in the race at the point their votes are distributed in an attempt to mimic real-life transfer patterns as closely as possible.
Some parties will need fewer first preference votes to win seats because they are so many people’s second or third choice, Fianna Fáil being a good example. They are ‘transfer friendly’, and are the opposite of ‘transfer toxic’ parties which have a hard core of support but are disliked by everyone else. Sinn Féin used to be like this but have improved their ability to win transfers recently.
The baseline ratios were created from past results and tested across a range of results. Some races are decided by very small margins and because a specific candidate is particularly likeable - or unlikeable.
The methodology within this projection will continue to evolve to improve accuracy, remove bugs, and to adapt to candidate announcements. As a result, the seat numbers being projected by a given set of vote shares could be different in a few weeks.